
Bienvenue au Laboratoire Géoazur
Observatoire de la Côte d'Azur
Université Côte d'Azur
UMR 7329 CNRS - UR 082 IRD
Le laboratoire Géoazur est une Unité Mixte de Recherche pluridisciplinaire, composée de géophysiciens, de géologues, et d’astronomes se fédérant autour de grandes problématiques scientifiques : les aléas et risques naturels (séismes, glissements de terrain, tsunamis, crues) et anthropiques (séismes et vibrations induits par l’homme, pollutions, comportements humains, vulnérabilités des territoires et des structures), la dynamique de la terre et des planètes, les géosciences des environnements marins (de l’innovation numérique et instrumentale aux applications), et la géodésie et métrologie spatiale. en savoir plus
Directeur : Boris MARCAILLOU
Actualités
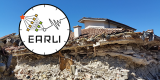
Les glissements de terrain et les éboulements peuvent provoquer des tremblements de terre
- Détails
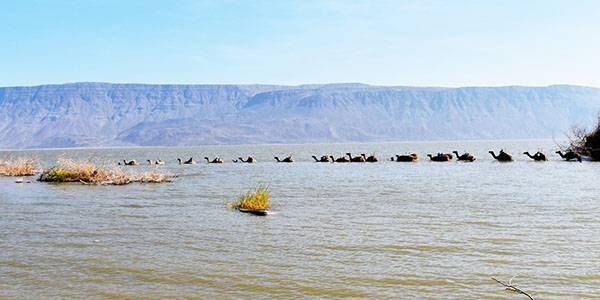
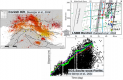
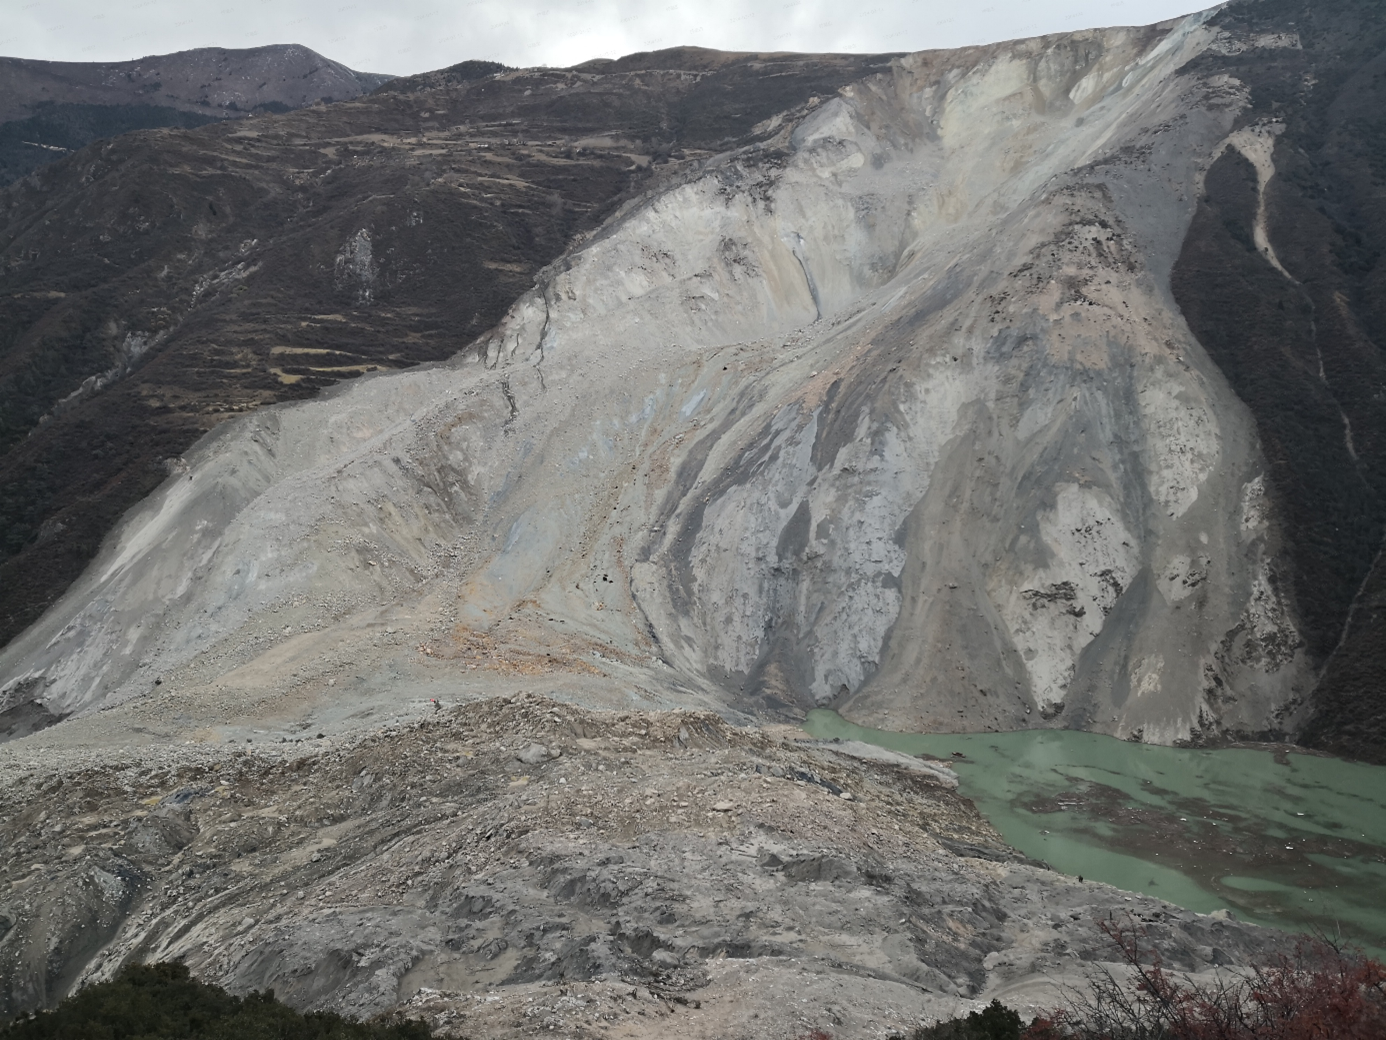 Une étude du WSL1, impliquant les travaux de Małgorzata Chmiel, post-doctorante à Géoazur, montre que les glissements de terrain et les éboulements peuvent provoquer des séismes en formant des lacs de barrage. Cette étude vient de paraitre dans Nature Communication.
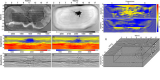
Et si l’origine des grands séismes était multiple
- Détails
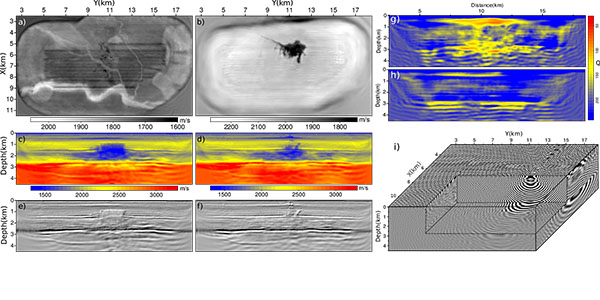
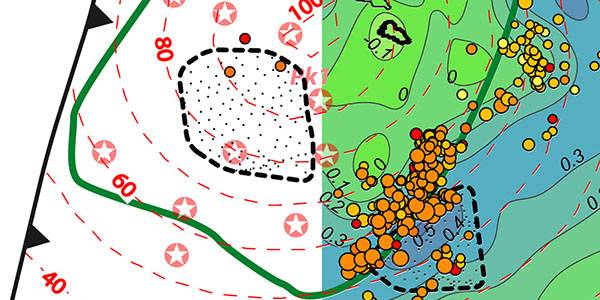
 Caroline Chalumeau a fait sa thèse à Géoazur et travaille aujourd’hui à l'Institut de technologie de Karlsruhe (KIT) en Allemagne. Avec des chercheurs du KIT et Audrey Galve, chercheuse à Géoazur, ils viennent de publier dans la revue Nature, une étude qui suggère que les grands séismes comme celui survenu début avril 2024 au large de Taïwan pourraient ne pas être une rupture unique, mais une série de ruptures dans un réseau de failles.
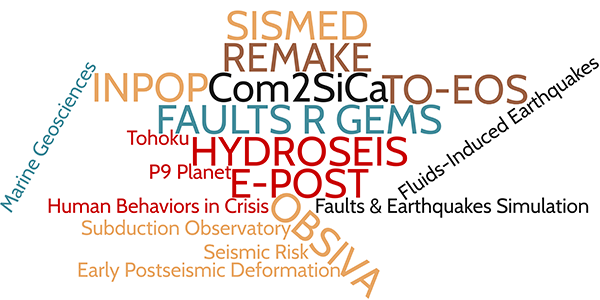
LES PROJETS DE RECHERCHE PHARE


UMR Géoazur
Campus Azur du CNRS
250 rue Albert Einstein
- CS 10269 - F 06905 SOPHIA ANTIPOLIS Cedex
+33 (0)483 618 500
![]()
![]()
![]()
![]()